Benchmark Webservers
Benchmark Testing Script
介紹使用 Tool + Script 讓測試變得有效率
**Servers**
AB server:

IP: $AB_IP
 /benchmark/
 - multi.sh
 - single.sh
 - conf/
 - archive/

Which will test ab concurrent (1,10,100) + (hello.php,static.html,wordpress) + (lsws,ols,apache,nginx) total 3*3*4=36 combination.
Web server: IP: $DUT_IP Switch 4 type of web servers
- switch_web.sh Switch 4 types of webserver’s cache
- web_cache_switch.sh
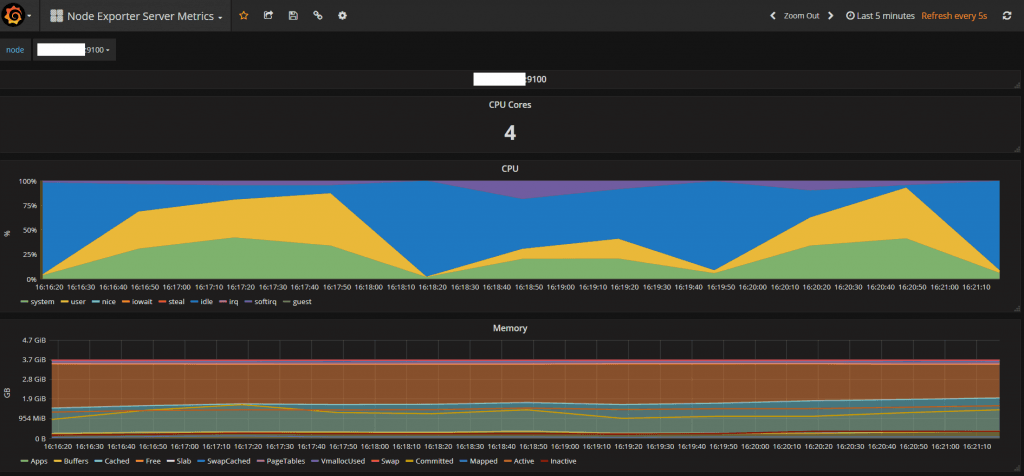
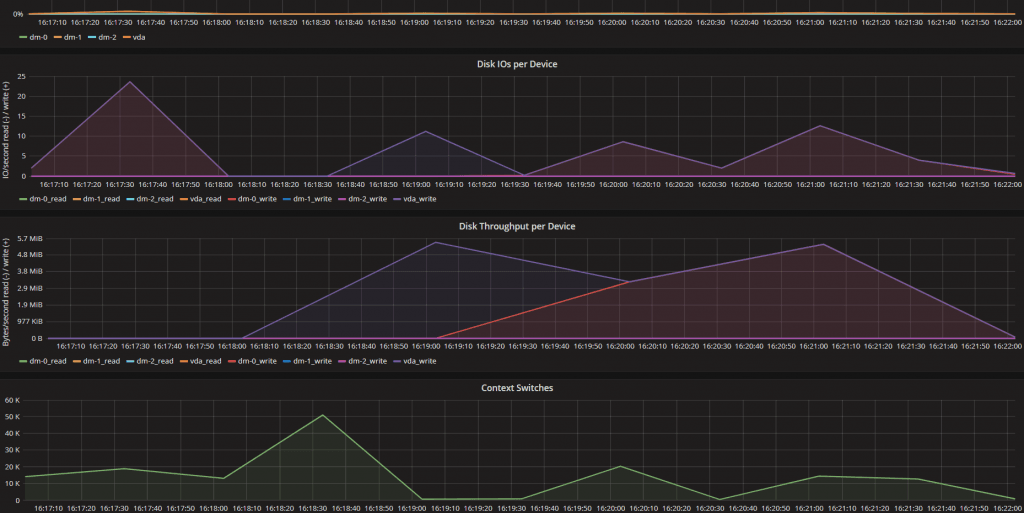
Monitor server: IP: $Monitor_IP:3000 Grafana monitor tool + Prometheus Which can collect and show CPU, Memory, Load, Disak IO, Network..
How to use: Want to test all servers and files, then just run
./multi.shIf you only want to test 1 server, then run./single.shProcess shows like this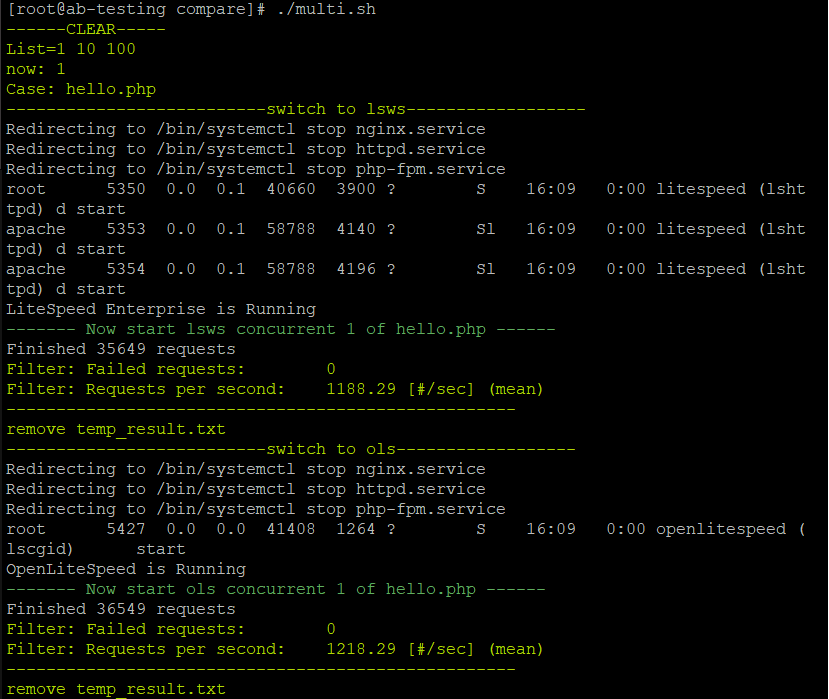 At the end of the testing, log will shows like this: Copy archive/1519679350 to
 /var/www/htmlSee result herehttp://$AB_IP/1519679350Copy the URL and you will see three results of images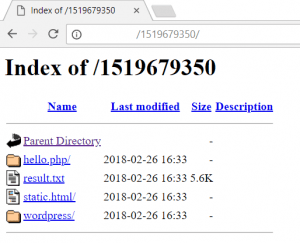 Click one of the folder, e.g. hello.php
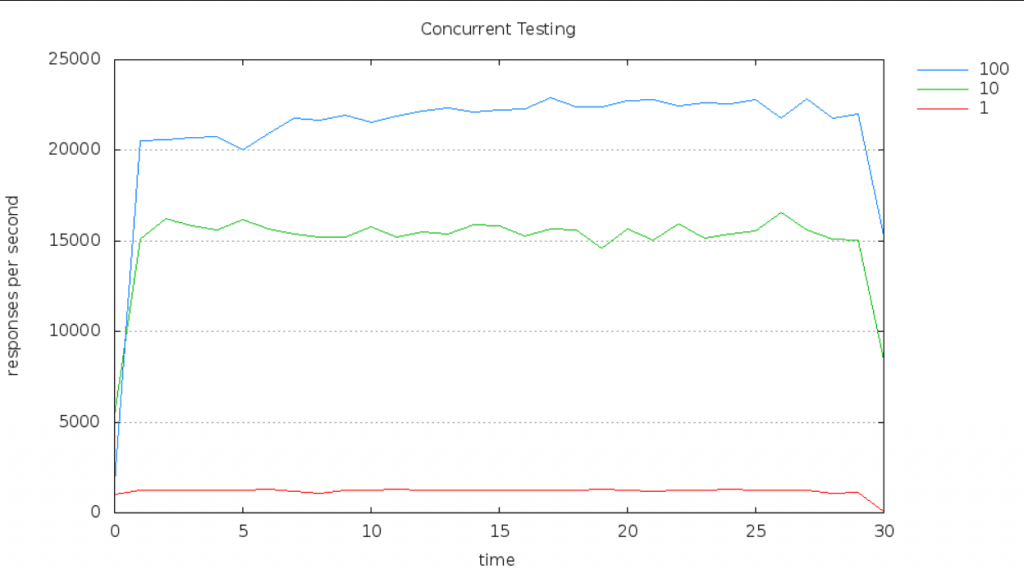
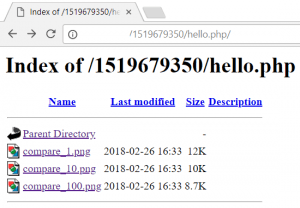 Click one of the results, e.g. compare_10.png You may also want to take a look if there is any “Failed requests” and need to be fixed. If you test with single server, e.g. ./single ols, you may see 1 server with three concurrent result image
Monitor tool:
http://$Monitor_IP:3000/dashboard/db/node-exporter-server-metrics?orgId=1&var-node=$Monitor_IP:9100&from=now-5m&to=now&refresh=5s
Then you will see the last 5 mins server load + page update every 5s
Follow the steps If you need to save the load image
Click Share dashboard
Click Snapshot
Click Local Snapshot
Then you will get an url, e.g. http://$Monitor_:3000/dashboard/snapshot/1j4am1dFMYp0RlIaeWRSxazCDnSpcwln
How to generate the chart 1. Tool: gnuplot 2. Need config file to collect the number Refer: How to setup Grafana
Leave a comment