Install Prometheus Grafana
Prometheus 是一個基於 Golang 語言所撰寫的服務效能測量監控系統。它通過 HTTP 協定從遠方機器收集數據並儲存於本機時序數據上。 本機須安裝 Prometheus 軟體, 而被監控的伺服器則需要安裝exporter 來收集監控數據. 我將使用 node_exporter 來當作範例. Grafana 是一個開源數據視覺化平台, 我們將搭配 Prometheus 來使用. 最重要的是這些服務都不用收費
1. 安裝與啟用 Prometheus
首先進入 Prometheus 的下載頁面選擇適合的檔案下載並解壓縮. 進入解壓縮目錄可以看到 config file 為 prometheus.yml先不更動, 直接跑 ./prometheus 此時開啟網頁並輸入 http://your_server_ip:9090 即可看到 prometheus 管理介面 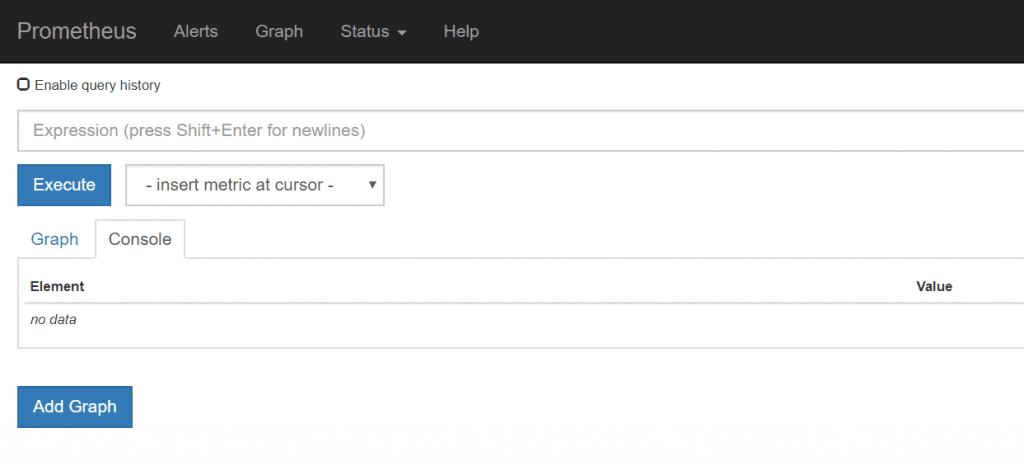 對著 insert metric at cursor 下拉選單任選 e.g. go_gc_duration_seconds 然後點擊 graph. 即可顯示以下圖表
 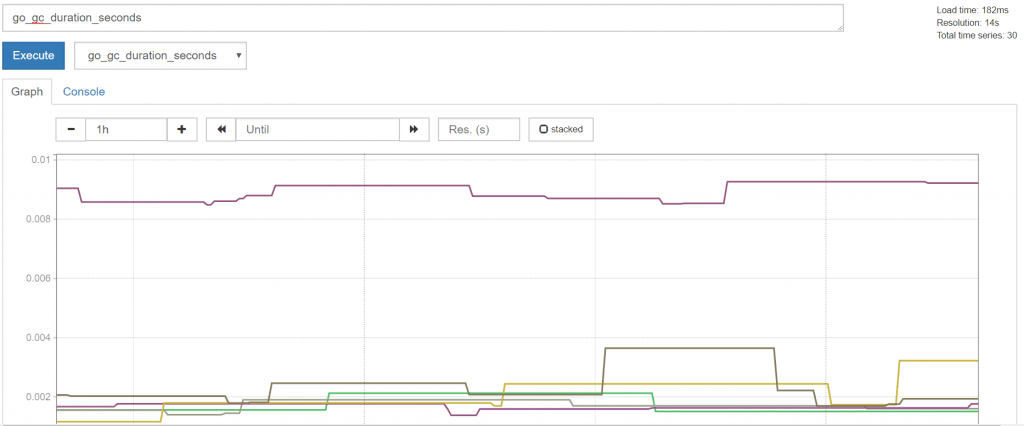 目前數據都來自 Prometheus 系統內數據. 接下來需使用 node_exporter 搭配收集監控數據.
2. 安裝並啟用 node_exporter
exporter 需安裝於被監控的伺服器上, 但也可以是 Prometheus 監控本機伺服器 ^ ^
wget https://github.com/prometheus/node_exporter/releases/download/v0.14.0/node_exporter-0.14.0.linux-amd64.tar.gz
tar -zxvf node_exporter-0.14.0.linux-amd64.tar.gz
入解壓縮的檔案夾, 執行 ./node_exporter 輸入 http://your_server_ip:9100 確認 Node Exporter 正常運作 
3. 監控已安裝好 node_exporter 的伺服器
此時須設定 prometheus 內的設定檔 prometheus.yml 目前僅需更改 scrape_configs 即可
scrape_configs:
- job_name: 'prometheus'

# Override the global default and scrape targets from this job every 5 seconds.
scrape_interval: 5s

static_configs:
- targets: ['localhost:9090']      #監控本機 prometheus

- job_name: 'Example'

static_configs:
- targets: ['localhost:9100']       #監控 node_exporter
labels:
group: 'Local-Node'
設定完後在使用 ./prometheus 重啟一次 prometheus 網頁輸入 http://your_server_ip:9090/targets 即可確認設定是否成功. 成功取得資訊即會顯示 UP 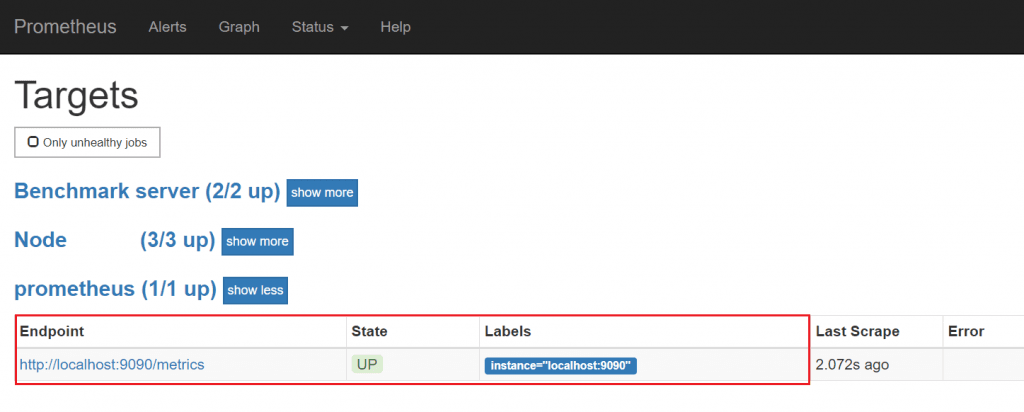
4. 結合 Grafana 面板
小弟我使用 prometheus 指令太過多樣覺得頭暈不舒服, 發現原來其它使用者有結合漂亮的面板, 立刻也來試一下.
a. Download & Install
Grafana download 或直接使用以下命令安裝並執行
wget https://s3-us-west-2.amazonaws.com/grafana-releases/release/grafana-4.6.3-1.x86_64.rpm
yum localinstall grafana-4.6.3-1.x86_64.rpm
systemctl start grafana-server
b. 新增 Prommetheus 為資料來源
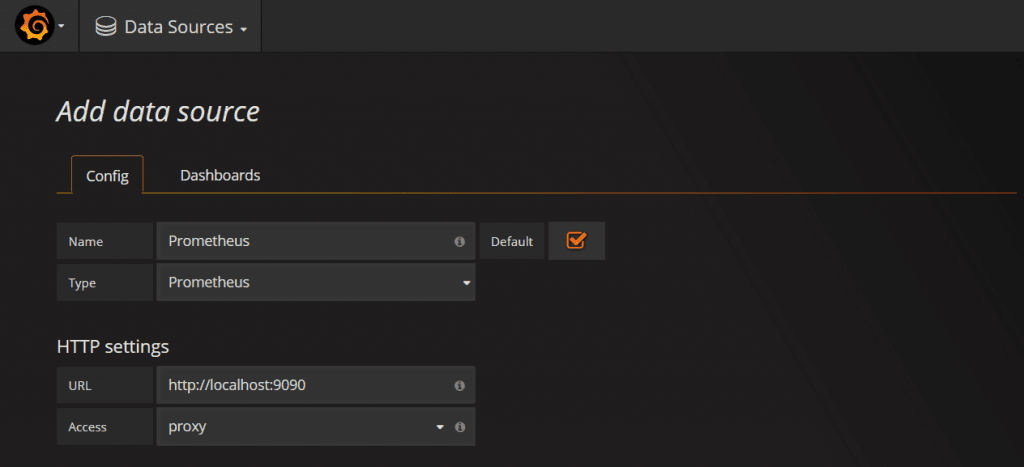
Grafana 主畫面請輸入 http://your_server_ip:3000/ 點選 main menu -> Data Sources -> Add new
- Name: Prometheus
- Type: Prometheus
- URL: http://
:9090</span>, (default port is 9090) - Access: proxy
c. Import Prometheus 面板
Import Prometheus Stats Dashboard
Download prometheus-dash
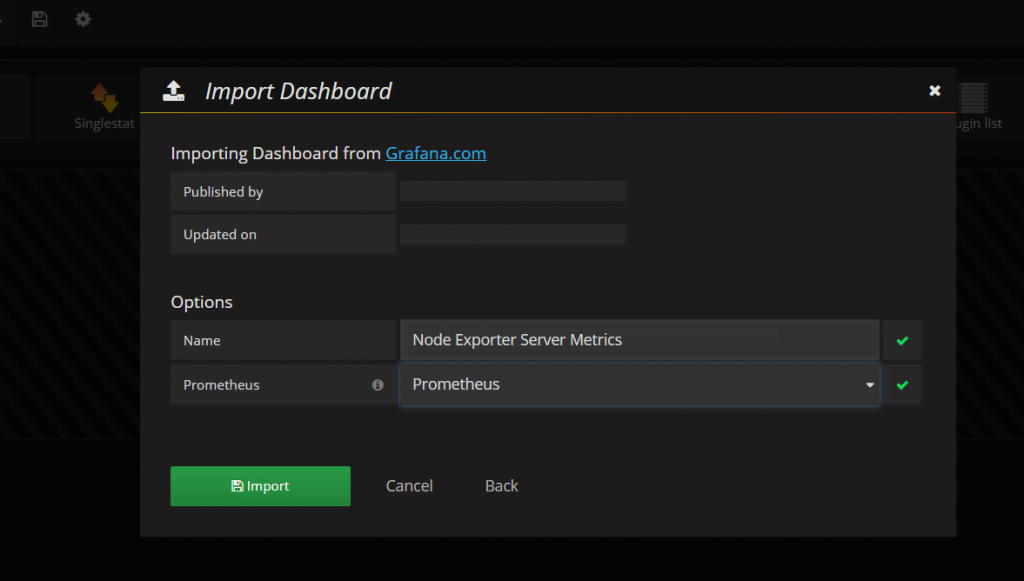
點擊 Import File -> Choose file .
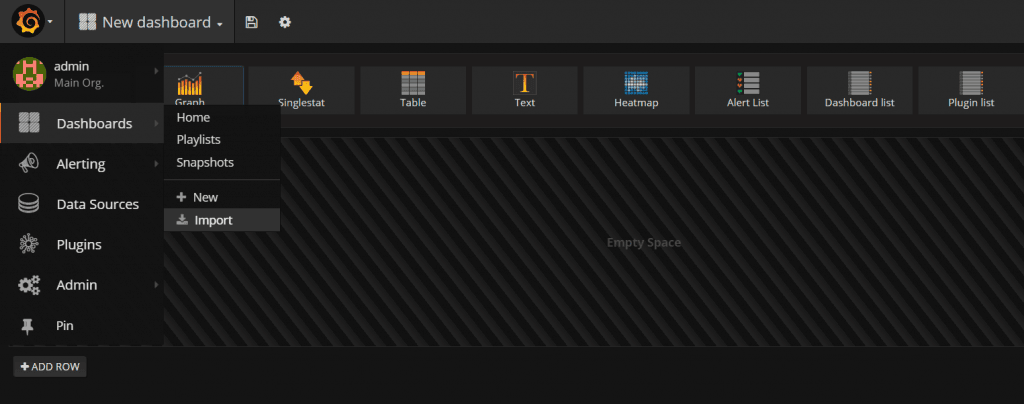
上傳 prometheus-dash.json 並選取 Prometheus.
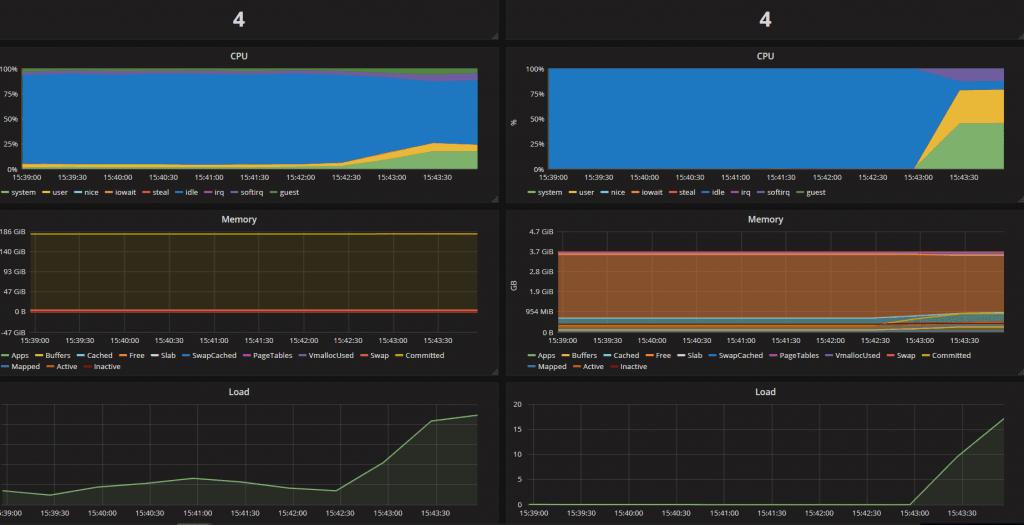
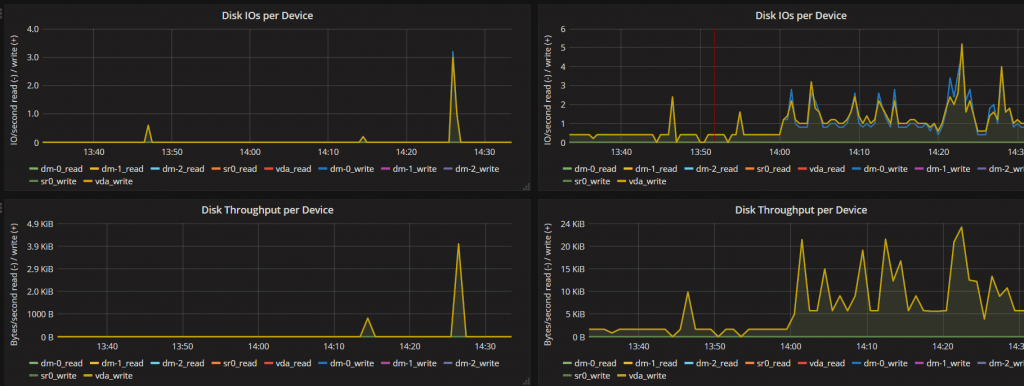
d. 檢視數據
檢視 Prometheus Stats Dashboard. 可以選擇多個節點一起檢視.
e.客製化面板參數
how-to-add-a-prometheus-dashboard-to-grafana
5. 優化執行程式方式
每次使用 ./XXXX 來跑程式實在繁瑣. 建議將此執行加入 systemctl list 先將執行程式複製到 /usr/local/xxx, e.g. 搬移 prometheus 檔案夾到 /usr/local/prometheus/prometheus 開一個服務, e.g. prometheus.service
Edit /etc/systemd/system/prometheus.service
[Unit]
Description=node_exporter
[Service]
Type=simple
ExecStart=/usr/local/node_exporter/node_exporter
[Install]
WantedBy=multi-user.target
開啟程序方式變為
systemctl start prometheus
確認執行狀態
systemctl status prometheus
同理 node_exporter 也可使用相同方式執行. 建議設一個使用者給 Prometheus 使用而非 root 會是比較好的方法
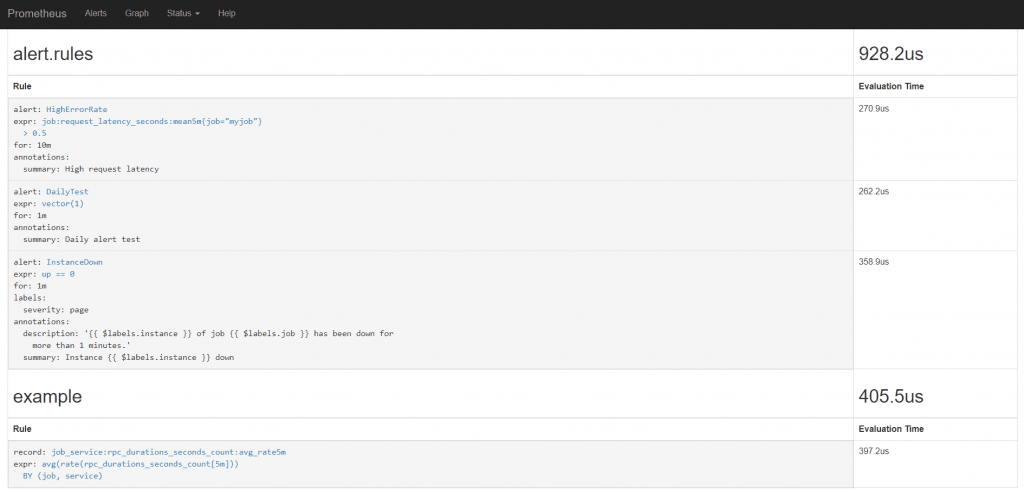
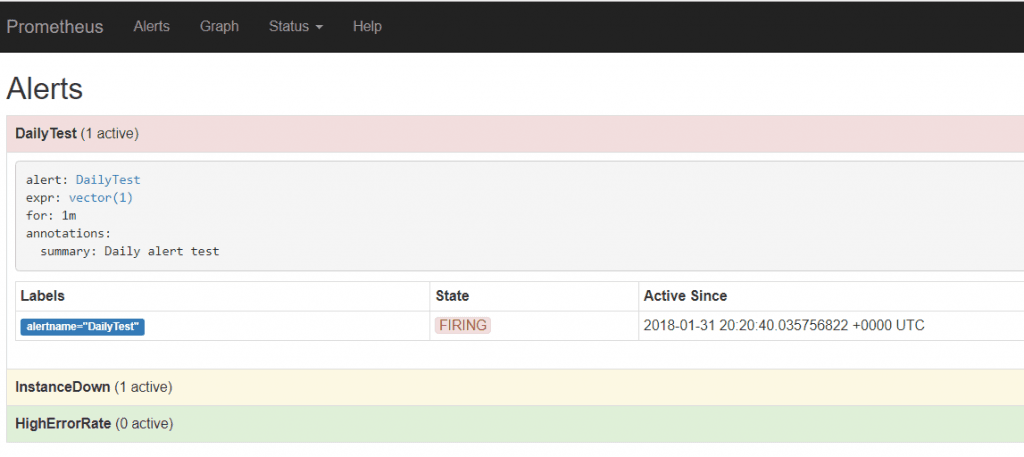
6. 優化執行程式方式
監控重點之一為 Alert. 當伺服器失聯或是 CPU /Memory 使用過高, 網路延遲高 等等都可以自訂觸發 Alert. Prometheus 有 Alert 於頁面上可觀察, 但我們需要串接 email 或其他通訊平台來提高警覺. 此時需額外裝上 AlertManager 來串接.
Leave a comment